| ♦ Tweak Linearization | |
|---|---|
|
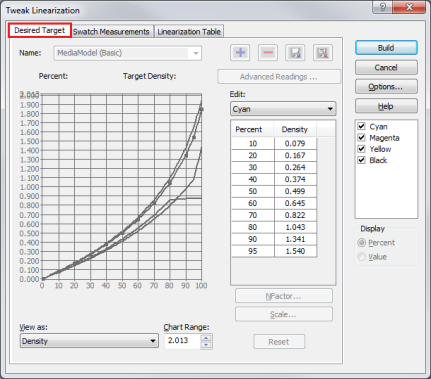
Use the [Desired Target] tab to view and edit the density targets for a linearization calibration.
[ + ] button opens a dialog for adding a new media model and selecting [Basic] (recommended) or [Advanced] (Non-ICC Workflow).
[ - ] button deletes existing Media Models.
[Save] button saves the currently selected Media Model.
[Save as] button allows to save or rename a Media Model.
[Advanced Readings] button displays measurements from an [Advanced Media Model].
Edit - Select the color you want to edit from the drop-down menu. Then click in the chart to edit the values.
View As - Select either [Density] or [Effective Dot Area] from the drop-down menu to view.
NOTE: The [Scale] button will change to Dot Gain when viewing as Effective Dot Area.
Chart Range - The [Chart Range] value controls the maximum density (y axis) value shown on the graph. Adjust this by clicking the up or down arrows.
NFactor - The [N-Factor] value controls the density of the mid-tones for a color channel. The default NFactor setting is [2] (recommended), and has a range of [1.0] to [5.0].
Scale - The [Scale] value evenly scales the density values for the color channel. The [Scale] function does not remember the previous settings, in other words, whenever [Scale] is used, the current value is considered a 100% scaling, regardless of whether the color channel was previously scaled.
Dot Gain - The [Dot Gain] is the value for how much the dot expands when it hits the paper. Click this button to set the value from [-49] to [49].
Reset - This option returns settings to previous value.
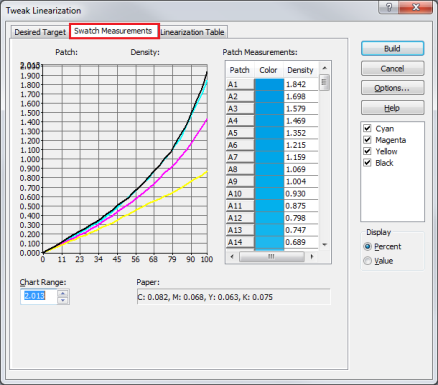
The [Swatch Measurements] tab shows the density measurements that were read from the linearization swatch. The measurement values are shown per color under Patch Measurements; as well as plotted on the graph.
Chart Range - The [Chart Range] value controls the maximum density (y axis) value shown on the graph. Adjust this by clicking the up or down arrows.
Paper - The [Paper] area shows the density readings of the media itself (with no ink applied).
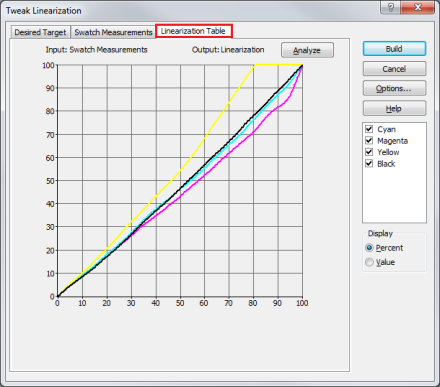
The [Linearization Table] tab shows you the linearization in graphical form. The Linearization (Table) is a result of the desired targets, swatch measurements, and linearization options (variance and smoothing). You may not change the linearization table directly. Click [Analyze] to check for errors within the Linearization table.
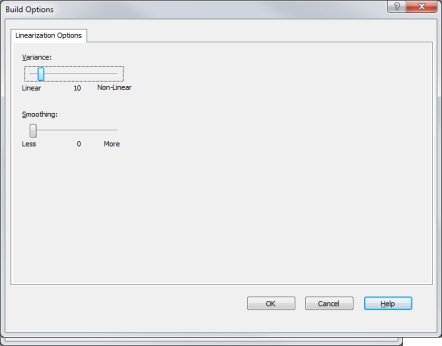
Clicking [Build] button finalizes the Tweak Linearization step. Use the linearization [Build] options to determine how a linearization is created from the density readings.
Variance - Use the [Variance] setting to specify how linear the linearization should be. Set the slider to Linear (Variance = 0), Non-Linear (Variance = 100), or anywhere in between. The default and recommended setting for Variance is 10.
Smoothing - Use the [Smoothing] slider to even out spikes in the linearization data. The range of the Smoothing setting is from 0 to 11. Smoothing should be used when significant spikes exists in the density readings; even after re-reading the linearization swatch. Setting a Smoothing value above 4 may cause the density readings to become inaccurate, resulting in poor color reproduction when printing.
For instructions on generating G7 advanced calibrations, see Advanced Grayscale G7 Calibration. TIP: To learn more about Color Management and Calibration go to this Thrive article and click the Maxi-imize tab. |
Figure 1
Figure 2
Figure 3
Figure 4 |


