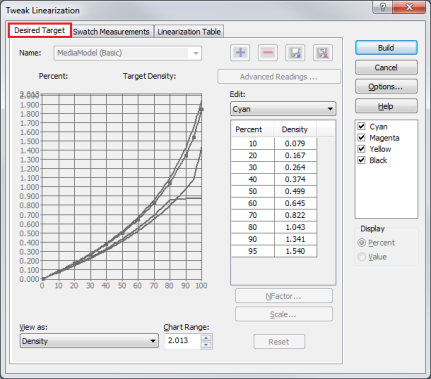
Use the [Desired Target] tab to view and edit the density targets for a linearization calibration.
[Name] lists all existing Models.
[ + ] button opens a dialog for adding a new media model and selecting [Basic] (recommended) or [Advanced] (Non- Workflow).
[ - ] button deletes existing Media Models.
[Save] button saves the currently selected .
[Save as] button allows to save or rename a Media Model.
[Advanced Readings] button displays measurements from an [Advanced Media Model].
Edit - Select the color you want to edit from the drop-down menu. Then click in the chart to edit the values.
View As - Select either [] or [Effective ] from the drop-down menu to view.
NOTE: The [] button will change to when viewing as Effective Dot Area.
Chart Range - The [Chart Range] value controls the maximum density (y axis) value shown on the graph. Adjust this by clicking the up or down arrows.
NFactor - The [N-Factor] value controls the density of the mid-tones for a color channel. The default NFactor setting is [2] (recommended), and has a range of [1.0] to [5.0].
Scale - The [Scale] value evenly scales the density values for the color channel. The [Scale] function does not remember the previous settings, in other words, whenever [Scale] is used, the current value is considered a 100% scaling, regardless of whether the color channel was previously scaled.
Dot Gain - The [Dot Gain] is the value for how much the dot expands when it hits the paper. Click this button to set the value from [-49] to [49].
Reset - This option returns settings to previous value.

 Desired Target Tab (Figure 1)


